


Some of the United States’ most homogeneous cities attract a surprisingly diverse set of newcomers. Others still seem to be magnets for white people, but more on that later.
We know this because every year, millions of people choose to move across county, state, or even country lines. There may be extenuating circumstances, but broadly, each person who relocates is expressing a strong preference for where they want to be and whom they want to be with.
With detailed census data, we can see their preferred destinations among the 100 largest metro areas, and crucially for this post, which places draw in a broad spectrum of Americans and which are attractive only to a certain subset.

We’re examining only newcomers. Outgoing movers, net migration and other components of growth will have to wait. Most moves, of course, tend to follow population. But more nuanced patterns will emerge when we adjust for size and break down figures by race and ethnicity.
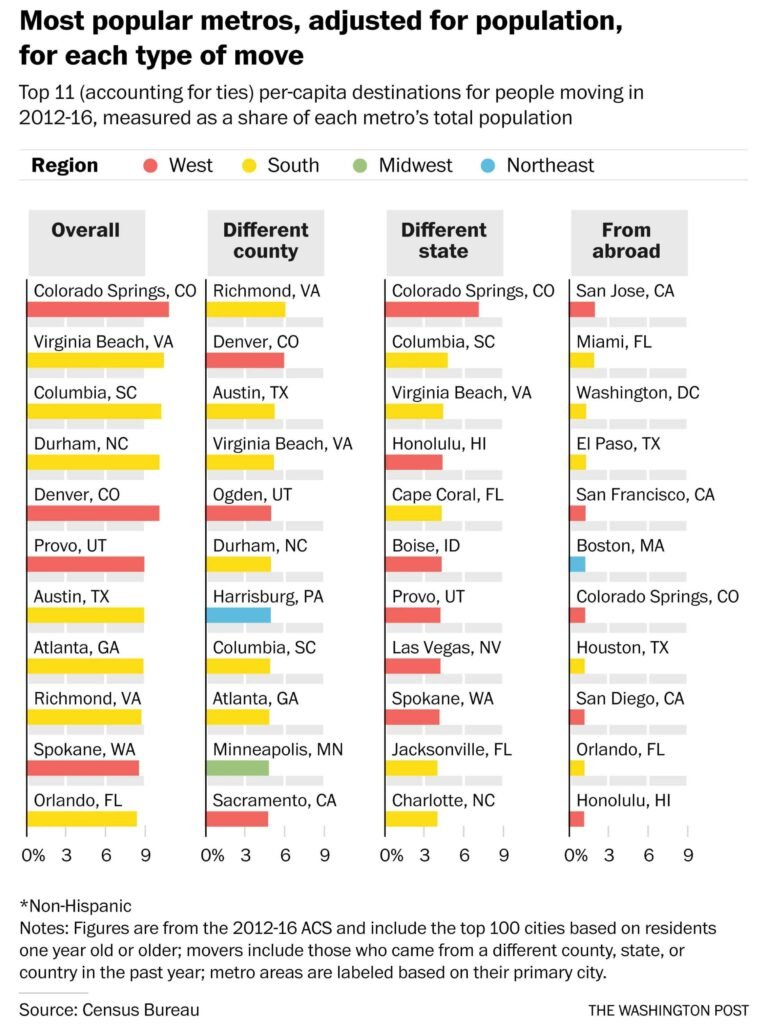
New York wins the overall popularity contest, as you may have guessed. The nation’s largest metro area, which is particularly dominant among those who come from abroad, has long relied on a steady stream of fresh, young faces to feed its growth.
But when you take population into account, New York vanishes and is replaced by other locations that are luring residents with strong economic growth (San Jose, Calif.) or a large university (Provo, Utah) or a military presence (Virginia Beach, Va.), and thus tend to have more transient populations.
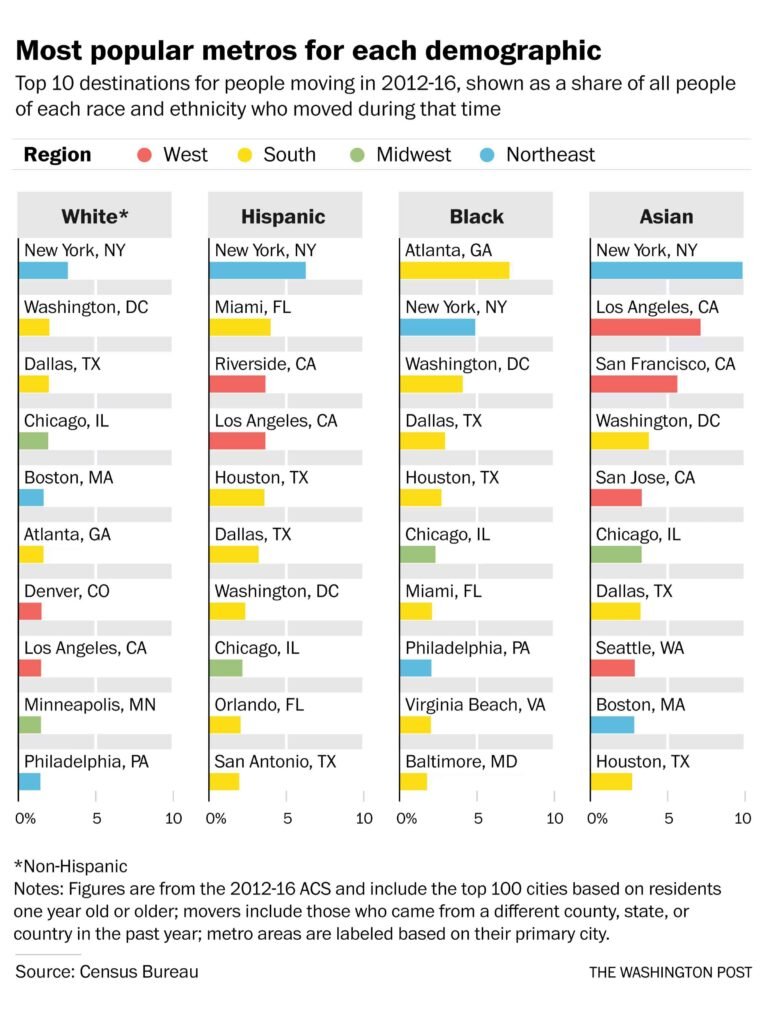
These overall numbers mask vast variations within racial and cultural groups. Among African Americans, notably, the most popular destination isn’t the New York area — it’s Atlanta.
Asians trend in the opposite direction: Almost one in every 10 Asians who moved during our time period ended up in the greater New York area. Part of this is the result of immigration — 3.3 percent of U.S. residents who identify as Asian moved from other countries during this period.
Those headliners demonstrate a common pattern: With a few notable exceptions (Washington, D.C., foremost among them), the nation’s movers tend to follow prior demographic distributions.
Non-Hispanic whites and Hispanic residents of all races end up in New York, but their preferences after that diverge. Boston and Denver are popular among whites, but don’t even register in the top 10 for Hispanics, who favor Miami and Southern California, which includes Riverside, San Bernardino and Ontario.
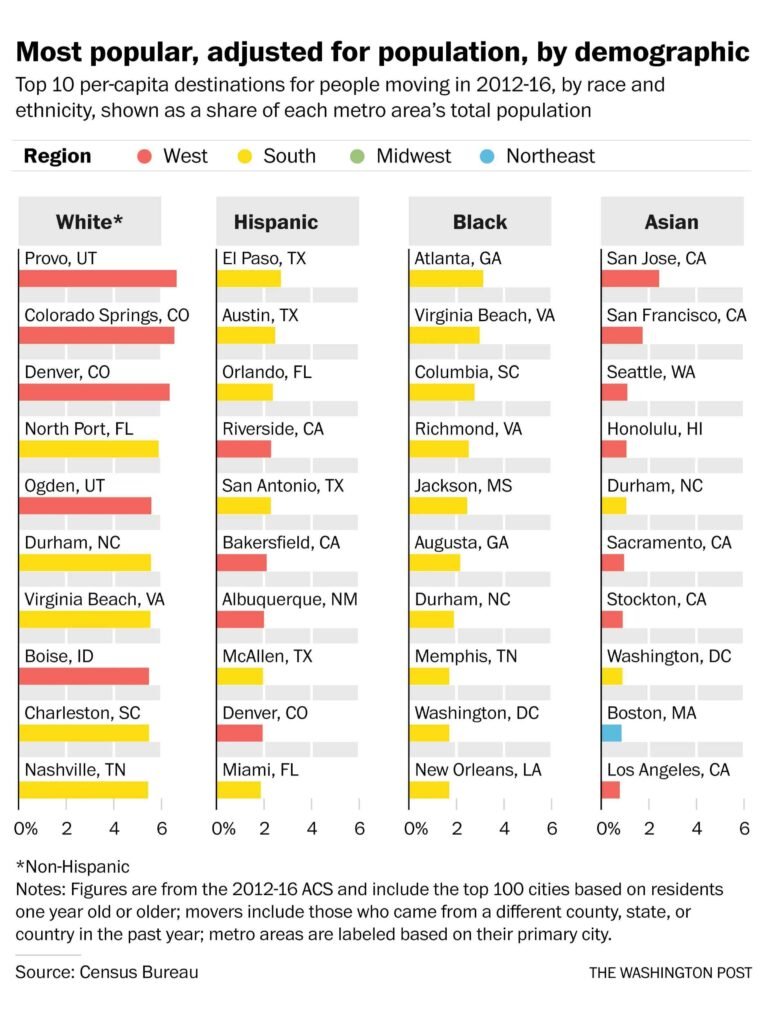
As we’ve seen before, established population centers dominate any chart based on population. With few exceptions, smaller, trendier towns such as Durham, N.C., don’t make the cut regardless of their universities or economy.
But when we adjust for size, the Durham-Chapel Hill area, in the heart of North Carolina’s Research Triangle, ranks in the top 10 destinations for Asian (5th), white (6th) and black (7th) movers. Overall, it ranks up with Virginia Beach and Colorado Springs as the metro areas with the highest share of recent arrivals.
The chart suggests that people who moved recently are looking outside the traditional coastal population centers, as well as established central-state behemoths such as Chicago, Dallas and Houston, and toward the South and the mountain West. The exception is Asian movers, who tend to follow a more traditional pattern.
It also gets a bit distorted by places that draw significant numbers of new arrivals for education or military service (or both). Colorado Springs’ metro area, for instance, includes Army and Air Force bases, as well as several universities and the Air Force Academy. El Paso and Virginia Beach are also military destinations.
That doesn’t entirely explain their popularity, as there are many other military and college towns (and areas with large populations in correctional institutions) buried deep within the rankings.
The above chart answers only “which places are most attractive to each group,” a question in which the same metro could conceivably top all four broad categories, and not “which places bring in movers of just one demographic.” Many metros on this list show up multiple times – there are newcomers of every race and ethnicity in Virginia Beach, Durham, and Washington, D.C. But what are the trends in areas that have a narrower appeal?
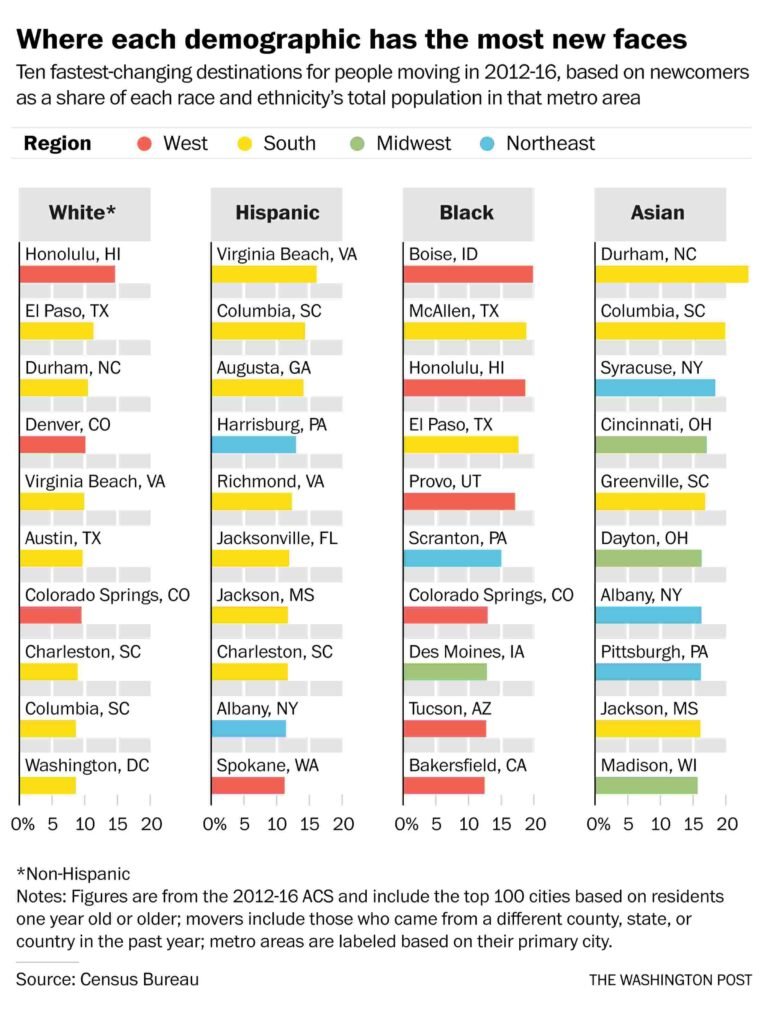
The next chart goes beyond broad national trends to the point that it may not really be considered a measure of popularity. Instead, it reveals those regional towns where each group may be either sorting itself or repeating long-established patterns of concentration.
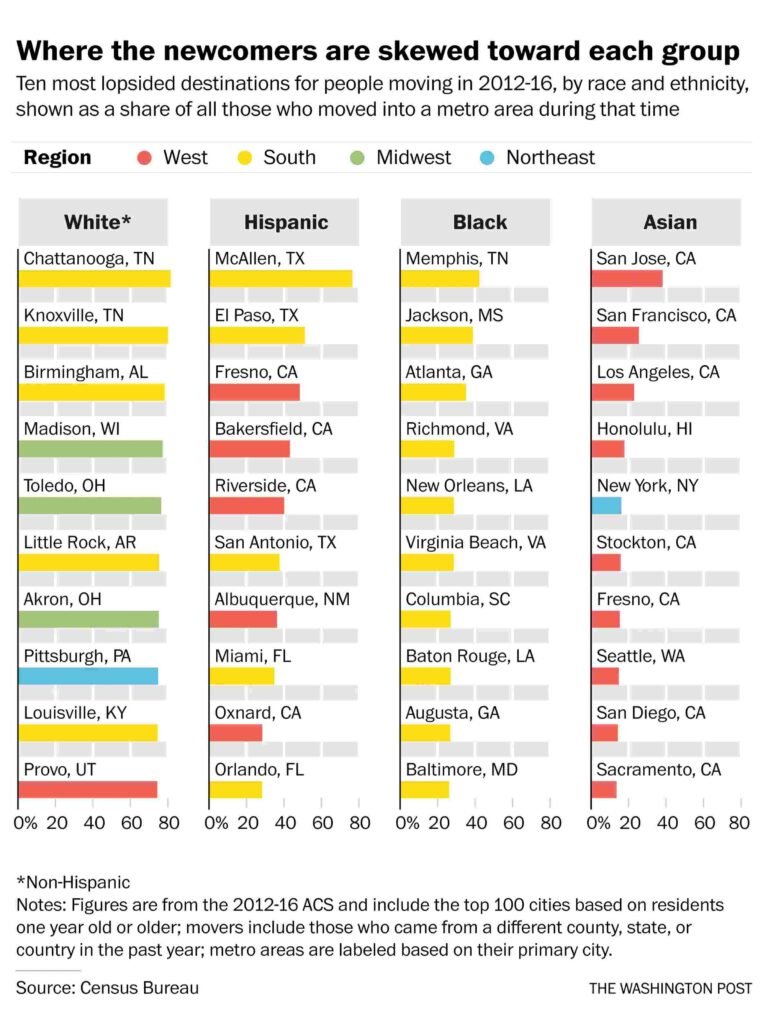
To better answer the question of narrow or wide appeal, we can look at the newcomers relative to the overall distribution of race and ethnicity in each metro area.
This can be distorted by small numbers—the 19.8 percent share of new black residents in the Boise, Idaho area is based on a total black population of 6,111—but even in cases where they don’t show a significant population movement, they show where new faces are having the biggest effect on a group’s presence.
Broadly, one thing stands out: White people love Colorado. Denver, Aurora, and Lakewood together account for the 21st largest metro area in the United States in terms of total population by our measure, yet it’s the seventh most popular among whites.
Taking into account population, Colorado Springs and Denver are the second and third most popular destinations among whites. And even relative to their already substantial white populations, both metro areas are in the top seven in terms of how many new, white faces they have.
Each of the four groups in the above chart is diverse. The whites or Asian Americans moving into one area may be of completely different ancestry and demographics from those moving into another. This only gives the broadest outlines of who tends to end up where.
But that reinforces the chart’s message, which is that places that once had no diversity to speak of are attracting groups that had little traditional presence in the area. Look up and down the columns for each race and ethnicity, note the regions and states where each has a substantial new presence, and you’ll recognize how millions of moves to hundreds of places are literally changing the faces of midsize American metro areas.